A GPU cluster is a set of multi-node servers connected by high-speed fabric (NVLink, NVSwitch, and InfiniBand) so that distributed AI training jobs can span more memory and compute than any single machine provides. On H100 SXM nodes, NVSwitch delivers 900 GB/s bidirectional bandwidth per GPU; a PCIe 4.0 x16 link tops out around 64 GB/s bidirectional. That 14× gap is the mechanical reason topology determines throughput before your training code runs a single step.
Adding GPUs does not close that gap. When every GPU's only path to the others runs through the shared PCIe root complex, collective bandwidth stays capped no matter how many cards you add, so eight PCIe-connected H100s can allreduce gradients at a fraction of what a single NVLink-connected node manages. Get the topology right and the same hardware behaves completely differently.
Scaling to multi-node surfaces three concerns at once: intra-node interconnect, inter-node fabric, and workload orchestration. They are interdependent, not separate. NCCL selects communication paths from topology detection, Slurm allocates GPUs through GRES configuration, and InfiniBand carries traffic based on interface assignment. Each layer can be individually correct and the cluster still broken. This guide treats the three as a single problem.
The scope is concrete: multi-node GPU clusters up to 8 nodes and 64 H100 SXMs. If you have run DDP or FSDP on a single node and hit either a VRAM ceiling or a throughput ceiling, this is where the next set of decisions lives.
When a Single Node Stops Being Enough
A single H100 SXM node is a ceiling once your model's memory footprint or training timeline exceeds what 640 GB of aggregate HBM3 and one step-per-second can deliver. The arithmetic is unambiguous, and the architectural response depends on which ceiling you hit first.
The memory case is straightforward arithmetic. A 70B parameter model in BF16 requires 70 × 10⁹ × 2 bytes ≈ 140 GB for parameters alone. Mixed-precision training with Adam adds three FP32 copies on top: master weights, first moment, and second moment, totaling 70 × 4 × 3 ≈ 840 GB of optimizer state. Combined, that is roughly 980 GB of training state for a 70B model, before activations and gradient buffers. A single H100 SXM carries 80 GB of HBM3, so eight of them give you 640 GB aggregate. That is enough to hold a 70B model's parameters with ZeRO-3 sharding, but a 400B model exceeds what any single node can hold regardless of sharding strategy.
Throughput is the second reason to scale, and it demands a different response. If your 7B model fits comfortably in single-node VRAM but training takes 30 days, the fix is data parallelism: identical model replicas across multiple nodes, each processing a different mini-batch, with gradients synchronized via allreduce after each step. That communication pattern maps cleanly to high-bandwidth inter-node fabric. Tensor parallelism, which splits individual layers across devices, works when the model will not fit on a single node, but it needs tight inter-device latency because every forward pass generates fine-grained all-to-all traffic. Tensor parallel ranks generally belong within a single NVSwitch domain; cross them over node boundaries and fabric latency becomes the forward-pass bottleneck.
That distinction has direct implications for cluster selection:
- Data-parallel training across eight nodes is communication-light relative to compute: gradient synchronization happens once per step, not once per layer. It can tolerate RoCE v2.
- Tensor-parallel training across eight nodes means every forward pass generates inter-node all-to-all operations. It wants InfiniBand with the lowest possible latency.
Intra-Node Topology: NVLink, NVSwitch, and What NCCL Sees
NVSwitch topology determines how fast your GPUs communicate within a single node, and whether that communication ever becomes a bottleneck. On SXM nodes it does not; on PCIe nodes it almost always does.
The NVSwitch on an H100 SXM node is a non-blocking crossbar switch embedded in the same module as the GPUs. Every GPU in the node can communicate with every other GPU at full NVLink 4.0 bandwidth, with no contention, no arbiter, and no CPU involvement. On a PCIe-connected system, GPU-to-GPU communication either routes through the CPU or through NVLink bridges between specific GPU pairs. The NVSwitch eliminates both constraints.
That crossbar is what makes the SXM form factor worth paying for. The per-GPU bandwidth gap the intro flagged, roughly 14× in NVLink's favor, is what a training run actually feels: an allreduce on a 7B model's gradients (~14 GB in BF16) runs in tens of milliseconds over NVLink but stretches into the hundreds over PCIe, so at a 1–5 second step it is the difference between the network being effectively free and being the run's bottleneck. Newer hardware narrows the gap only at the margin; PCIe 5.0 roughly halves it to around 7×, yet the practical peer-to-peer ceiling on multi-GPU PCIe systems stays far below NVLink.
NCCL detects topology automatically at initialization. When it finds NVLink peers, it routes through them instead of falling back to PCIe. You can inspect the selected path by setting NCCL_DEBUG=INFO before launching your job: the output exposes per-channel transport selection, distinguishing NVLink paths from routes that cross node boundaries. To force path selection, NCCL_P2P_LEVEL=NVL restricts intra-node peer-to-peer to NVLink-connected peers only. For unusual hardware where NCCL's auto-detection is wrong, NCCL_TOPO_FILE lets you supply a custom topology XML.
On H100 SXM nodes with NVSwitch, NCCL gets it right without intervention. Your training code needs exactly one configuration line:
NCCL handles path selection from there. Your job is ensuring the hardware and driver stack underneath it are correct, which is why the SXM form factor shapes throughput alongside the GPU generation, not just the generation on its own.

Inter-Node Fabric: InfiniBand, RoCE v2, and the ens1 Problem
Inter-node fabric is where a cluster quietly loses most of its bandwidth. NCCL can route every collective operation over the wrong interface at a small fraction of the intended speed, with no crash and no error message to flag it.
Off-node traffic runs over a dedicated fabric: on Runpod Clusters, either InfiniBand (up to 400 Gb/s per node) or RoCE v2, depending on configuration. Both use RDMA to keep the CPU out of packet transmission; the practical difference is latency, where InfiniBand is lower and costs more. Data-parallel training with large gradient tensors runs fine on either. Synchronous tensor-parallel training, with its fine-grained all-to-all traffic on every forward pass, is where InfiniBand's latency edge shows up in step time.
Runpod quotes 1600–3200 Gbps of aggregate networking between nodes, but do not assume it splits evenly; the per-node share depends on the fabric topology Runpod provisions for your tier, so verify it rather than dividing by node count.
The arithmetic is still a useful bound. A ring allreduce of a 7B model's gradients (~14 GB in BF16) moves 2 × (N-1)/N × 14 GB ≈ 24.5 GB in and out of each of 8 nodes, a reduce-scatter pass plus an all-gather. At an even-split 200 Gb/s per node (the 1.6 Tbps tier) that is roughly 980 ms; at 400 Gb/s (the 3.2 Tbps tier), about 490 ms. Against a 2–5 second step, communication runs on the order of 10–25% at the top tier, which is why lower-bandwidth fabric handles most data-parallel work and only bites once synchronization starts competing with compute.
The detail that breaks most inter-node setups is interface routing. Runpod Clusters expose up to 8 high-bandwidth interfaces (ens1 through ens8) for GPU-to-GPU traffic, while eth0 handles external connectivity. If you do not tell NCCL which to use, it finds eth0 first and sends every collective over the management network. That throws no error; it just runs an order of magnitude slower and occasionally times out mid-job.
The fix is one environment variable:
Set it in your .sbatch script, not your training code, since interface routing is an infrastructure concern. Runpod also sets MASTER_ADDR/PRIMARY_ADDR and MASTER_PORT/PRIMARY_PORT on every node, so your launcher can use them directly instead of resolving the rendezvous address by hand.
For the first runs on a new cluster, also set NCCL_DEBUG=INFO. It is verbose, but it reports which interface and transport NCCL chose (NVLS, P2P, or NET) and whether it found the InfiniBand device: a transport line reading NET/IB is the confirmation you want, and the smoke test later walks through reading that log when the fabric is not live. With NVLink and InfiniBand both verified, the last variable is getting Slurm to schedule work across that fabric.
Orchestration With Slurm: Managed and Unmanaged Paths on Runpod
Slurm is where the topology and fabric work from the previous two sections either pays off or quietly unravels. Each layer was configured on its own, but they only meet at runtime, so a job can allocate every GPU correctly and still lose most of its bandwidth the moment NCCL settles on eth0 instead of the InfiniBand path. The symptom is not a crash but a number. Per-node throughput looks right until collective operations cross node boundaries, then collapses, and the drop shows up in Slurm's own job timing rather than in any error log.
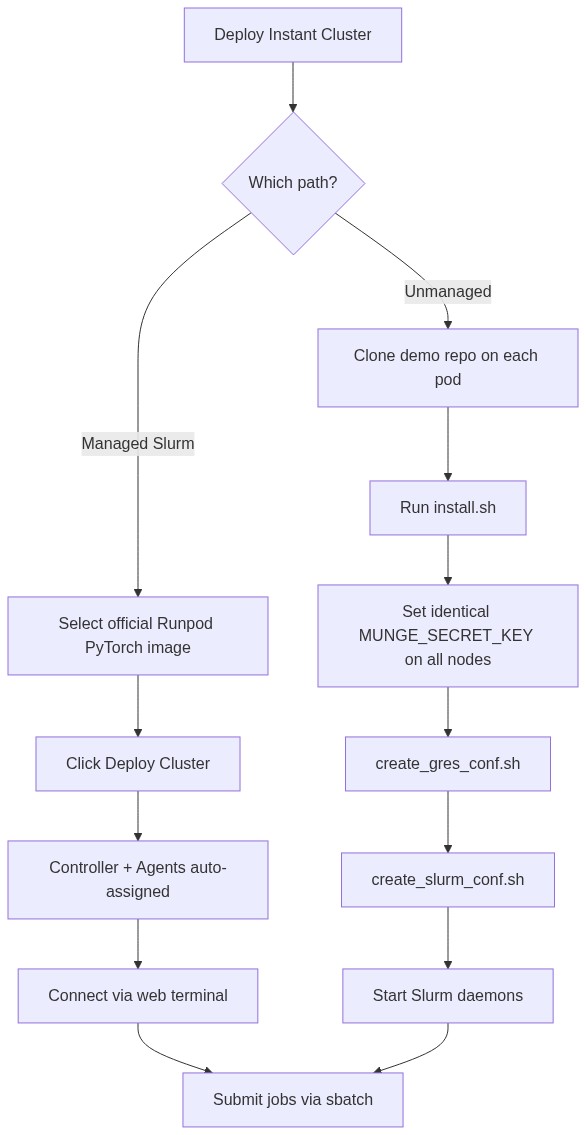
Runpod offers two ways to stand up that Slurm layer: a fully managed setup requiring zero manual configuration, and an unmanaged path for teams that need custom software stacks. The choice comes down to how much control you need over the cluster configuration.
The managed path
The managed Slurm Cluster is zero-configuration. The full deployment sequence:
- Open the Clusters page in the Runpod console.
- Click Create Cluster.
- Select Slurm Cluster from the cluster type dropdown.
- Configure the cluster name, Pod count (up to 8), GPU type (e.g., H100 SXM), region, and optionally a network volume.
- Select the official Runpod PyTorch image. This is required; Slurm processes will not start with other images.
- Click Deploy Cluster.
The platform assigns one node as the Slurm Controller and the rest as Slurm Agents, all visible in the console UI. It pre-configures MUNGE authentication across every node with a shared key and provisions the slurm.conf to reflect the cluster's hardware. You connect to the Controller through the web terminal and can submit jobs immediately, with no scontrol commands, GRES edits, or daemon restarts standing in the way.
The image requirement is load-bearing because of what the official Runpod PyTorch image carries: the Slurm and MUNGE components the managed path is built around, already wired for the H100 SXM profile. A custom image arrives without them, which is why the control plane has nothing to boot on top of.
The unmanaged path
The unmanaged path gives teams more control over CUDA versions, NCCL builds, or additional system dependencies not in the official image. After deploying a Cluster, the setup sequence on each pod is:
The create_gres_conf.sh step writes a Generic Resource (GRES) line to gres.conf, for example NodeName=node1 Name=gpu File=/dev/nvidia[0-7]. That line tells Slurm which GPU devices exist on the node and under what name a job requests them (--gres=gpu:8). A missing or mismatched GRES entry is exactly why sinfo -o "%n %G" later in this guide is the verification step: it shows what Slurm believes each node has available to allocate.
The MUNGE_SECRET_KEY step is a common place for unmanaged setups to fail. MUNGE is the authentication daemon Slurm uses for inter-node job control and task distribution. If the key differs between any two nodes, even by a single character, Slurm authentication fails, and the error may not surface on the submitting user's side: jobs can sit in PD (pending) state while squeue gives little indication of why. Set the key identically across every pod before running create_gres_conf.sh, and confirm it with echo $MUNGE_SECRET_KEY on each node before starting services. Full reference for this path: Runpod Slurm on Clusters (unmanaged).
Launching Multi-Node Distributed Training: torchrun, NCCL, and DeepSpeed
With the cluster running, launching training comes down to how torchrun, Slurm, and your PyTorch code exchange environment variables, with DeepSpeed ZeRO available once per-node VRAM requirements outgrow what data parallelism alone can handle.
Whether you used the managed or unmanaged path, job submission follows the same sbatch/srun pattern. A minimal .sbatch script for 2-node distributed training:
--node_rank=$SLURM_NODEID is how Slurm and torchrun connect: Slurm's SLURM_NODEID (0 for the first allocated node, incrementing from there) maps directly to torchrun's --node_rank. For the rendezvous endpoint the script uses the $MASTER_ADDR and $MASTER_PORT that Runpod sets on every node, so there is no need to derive the primary node's address by hand. --ntasks-per-node=1 keeps srun to a single torchrun per node, which then fans out to all 8 GPUs; without it, srun can start several torchrun instances on the same node and oversubscribe. The pattern is identical on managed and unmanaged Runpod clusters.
When srun launches torchrun, it spawns one torchrun process per allocated node, and each torchrun instance spawns --nproc_per_node workers, one per GPU. Those workers receive four environment variables that matter: LOCAL_RANK (0–7 within the node), RANK (the global rank across all processes), WORLD_SIZE (total process count), and MASTER_ADDR/MASTER_PORT (the rendezvous endpoint). Your training code reads them directly:
The local_rank / global_rank split is easy to gloss over and expensive to get wrong. All 64 processes across 8 nodes participate in collective operations, but only global_rank == 0 should write checkpoints, log to Weights & Biases, or print progress to stdout. Ignore that and 64 processes try to write the same checkpoint file at once; the corruption may not surface until a resume attempt fails later.
DeepSpeed ZeRO for models that still don't fit
If your model's per-node VRAM requirement exceeds what data parallelism alone can solve, DeepSpeed ZeRO adds the next level of sharding. ZeRO Stage 2 shards optimizer states and gradients across all ranks: the roughly 840 GB of FP32 Adam state for a 70B model (the master-weight and moment buffers from the memory math above) drops to about 13 GB per GPU once spread across 64 H100s. Stage 3 additionally shards parameters, which is what extends training to models with hundreds of billions of parameters and beyond.
DeepSpeed does not need a different launcher. Keep the same srun torchrun block and point your training script at a DeepSpeed config; deepspeed.initialize() reuses the process group torchrun already set up, reading the same RANK, WORLD_SIZE, and MASTER_ADDR, so the only change is the script's arguments:
Avoid wrapping the standalone deepspeed launcher in srun. That launcher does its own multi-node process spawning over SSH, and running it under srun starts it once per node, so the two launchers fight over the same ranks. Letting torchrun own process spawning keeps a single, predictable launch path. DeepSpeed uses NCCL as its communication backend on NVIDIA hardware, so the NCCL_SOCKET_IFNAME=ens1 setting from your job script carries over and no extra network setup is required. A minimal ZeRO Stage 2 configuration:
ZeRO Stage 3 adds parameter scatter/gather traffic on every forward pass. If your model fits with Stage 2, stay there; Stage 3 overhead becomes visible as inter-node bandwidth utilization climbs, and on lower-bandwidth clusters with large models you will notice it.
Everything in this guide, from torchrun/DDP to DeepSpeed ZeRO Stage 2 and 3, is data-parallel: full model replicas, or ZeRO-sharded replicas, each processing different data. Tensor parallelism, which splits individual layers across GPUs, is the architectural step past ZeRO-3 when sharding still is not enough, but it needs a framework like Megatron-LM and sits outside the scope of this guide.
Shared Storage, Checkpointing, and Avoiding I/O Bottlenecks
Shared network storage on Runpod Clusters removes per-node data synchronization before job launch, but it introduces its own throughput ceiling if you do not control how 64 GPUs hit it at once.
Runpod Clusters include native network storage, a shared filesystem reachable from every node simultaneously. Training datasets, checkpoints, and logs all live there. That removes the manual step of syncing data to each node before a job and avoids the fragmentation of per-node local storage, at the cost of a shared bottleneck if access patterns are careless.
For checkpointing, the reliable baseline is a tmp-file-plus-atomic-rename from rank 0 only:
Writing to .tmp and then renaming protects against checkpoint corruption on preemption. A partially written file left at the final path can look valid to a resume script yet fail on load. Write to .tmp, then rename. For DeepSpeed, use engine.save_checkpoint(output_dir, tag=f"step_{step}") instead; it handles sharded state across all ranks internally and does not need the rank 0 guard.
Data loading can bottleneck a cluster as hard as checkpointing, if not harder. Two things have to be right. First, each rank needs its own shard of the data, not just its own prefetch buffer: wrap the dataset in DistributedSampler(dataset, num_replicas=world_size, rank=global_rank) (or the equivalent sharding logic in WebDataset or Arrow) so that 64 processes each iterate a disjoint slice, and call sampler.set_epoch(epoch) at the top of each epoch so the shuffle actually changes between epochs. Without the sampler, ranks compute gradients from overlapping or duplicate batches and invalidate the allreduce, a correctness bug that no throughput tuning will surface. Second, once sharding is correct, throughput follows from prefetch: 64 GPUs pulling the next batch from a shared volume with DataLoader(num_workers=0) turn that volume into the ceiling, so set num_workers=4 at minimum to overlap loading with compute, and prefer memory-mapped formats. The Hugging Face datasets library's Arrow format and WebDataset both provide prefetch buffers that hide most of the I/O latency, and moving off num_workers=0 can recover several-fold effective GPU utilization on a 64-GPU cluster reading from a network volume.
If your dataset fits entirely in system RAM, load it once at job start and keep it there. The network volume matters again at checkpoint write time, but that is a periodic write, not a per-batch read.
Deploy Your First Cluster Today
Deploying a verified multi-node GPU cluster on Runpod takes minutes on the managed Slurm path, and a smoke test confirms the InfiniBand fabric before you commit any real training workload to it.
Using the managed path from earlier, deploy a 2-node cluster now: from Create Cluster, select Slurm Cluster, choose 2 nodes and the H100 SXM GPU type in your preferred region, attach a network volume, and pick the official Runpod PyTorch image, then click Deploy Cluster.
Once deployed, the console labels one node "Slurm Controller" and one "Slurm Agent." Connect to the Controller via the web terminal and verify the cluster before submitting any real workload:
Then submit a smoke-test job to confirm NCCL is routing through the InfiniBand fabric before you touch real training code. Create allreduce_test.py:
Submit it with a short job script:
Check the job log once the smoke test completes. The NCCL_DEBUG=INFO output shows which transport NCCL selected: NET/IB means InfiniBand is active, while NET/Socket over eth0 means the transport fell back to the slower TCP path and you should re-check the interface configuration. Once the log confirms NET/IB, you have a verified cluster. Swap in your actual training script and go.
Full documentation for the managed Slurm setup is at https://docs.runpod.io/instant-clusters/slurm-clusters. The PyTorch multi-node guide, with additional torchrun examples and an environment-variable reference, is at https://docs.runpod.io/instant-clusters/pytorch.
GPU Clusters for AI FAQ
What is a GPU cluster and how does it differ from a single multi-GPU node? A GPU cluster connects multiple servers, each with their own GPUs, CPU, and memory, over a high-speed network fabric such as InfiniBand or RoCE v2. A single multi-GPU node like an 8× H100 SXM server shares one NVSwitch crossbar and one pool of host RAM. A cluster extends both GPU memory and compute across nodes, enabling training runs that no single machine can support.
Why does NVLink topology matter more than raw GPU count for distributed training? On PCIe-connected nodes, allreduce operations share a ~64 GB/s path; NVLink 4.0 on SXM nodes gives each GPU 900 GB/s through a non-blocking NVSwitch crossbar. At a 1–5 second step time, that roughly 14× of headroom is what keeps gradient synchronization from stalling the GPUs between steps, so the run stays compute-bound instead of network-bound.
How do I confirm that NCCL is using InfiniBand and not the management network? Set NCCL_DEBUG=INFO before launching and read the transport line in the job log: NET/IB means the fabric is active. If it instead shows a socket transport over eth0, NCCL is on the management network, so set NCCL_SOCKET_IFNAME=ens1 in your job script and rerun.
What is the difference between ZeRO Stage 2 and Stage 3 in a multi-node context? ZeRO Stage 2 shards optimizer states and gradients across all ranks, delivering an order-of-magnitude reduction in per-GPU optimizer memory for a large model such as a 70B model on 64 H100s. Stage 3 additionally shards model parameters, extending training to hundreds of billions of parameters and beyond, but it adds parameter scatter/gather traffic on every forward pass. If your model fits with Stage 2, stay there; Stage 3 overhead grows more significant as inter-node bandwidth utilization climbs.
Why do jobs get stuck in PD (pending) state on unmanaged Slurm clusters? Almost always a MUNGE key mismatch. MUNGE authenticates every inter-node Slurm message, so if two pods hold different keys the scheduler rejects the handshake and parks the job in PD with no useful error. Before debugging anything else, confirm the key matches on all pods (echo $MUNGE_SECRET_KEY) and restart the Slurm services.
What image is required for the managed Runpod Slurm Cluster, and why? The official Runpod PyTorch image, because it bundles the Slurm and MUNGE services the cluster expects at startup, already configured for the H100 SXM profile. A custom image is the most frequent managed-path failure: the orchestration services simply are not present for the control plane to start.
How should checkpoints be written safely on a shared network volume with 64 GPUs running? Write checkpoints from global_rank == 0 only, using a .tmp file followed by an atomic os.rename() to the final path. That prevents 64 processes from writing the same file at once and protects against partial writes on preemption. For DeepSpeed, use engine.save_checkpoint() instead, since it handles sharded state across all ranks internally without the rank 0 guard.
What DataLoader settings prevent network storage from becoming the GPU utilization bottleneck? Two things. Give each rank real parallel readers (num_workers=4 or more) so loading overlaps compute, and give each rank a disjoint shard (DistributedSampler with set_epoch) so all 64 processes are not pulling identical batches. Memory-mapped formats like Hugging Face Arrow or WebDataset help further, serving each batch from a prefetch buffer instead of hitting the network every time.
Getting the Full 8x
The delta between deploying 8× the GPUs and getting 8× the throughput almost always comes down to the same four variables. Three of them you fix at runtime with an environment variable or configuration flag; the fourth, NVSwitch topology, is set when you choose the hardware and cannot be changed in software afterward.
- NVSwitch topology: SXM versus PCIe makes a 14× bandwidth difference. This is fixed at hardware-selection time and cannot be patched in software.
- Interface routing: NCCL landing on eth0 instead of ens1 is a silent performance killer. One environment variable, NCCL_SOCKET_IFNAME=ens1, fixes it for the run.
- Slurm GRES configuration: if nodes do not advertise the GPU count you expect, jobs run on fewer devices than you think. Verify with sinfo -o "%n %G" before submitting any real workload.
- DataLoader prefetch: num_workers=0 turns your network volume into the bottleneck. Raising it recovers meaningful GPU utilization on 64-GPU clusters reading from shared storage.
These four variables are the concrete form the intro's three layers, intra-node topology, inter-node fabric, and orchestration, take once a job is actually running. None of them requires deep systems expertise; you mostly need to know which log line to read and which knob to turn.
Runpod Clusters deploy a managed Slurm environment with a pre-configured controller, dedicated InfiniBand fabric, and shared storage, without a procurement cycle or an infrastructure team standing between you and your first run.