A CUDA out of memory error at the start of a training run is a decision point. You can reduce batch size until the model barely learns, or you can scale out. This guide covers the second option: distributed training across multiple GPUs on Runpod, written for teams who have already trained or fine-tuned on a single GPU and run into one of its ceilings. It runs from a single multi-GPU pod up to a Cluster spanning 64 GPUs across eight nodes.
When you need multi-GPU training
Memory is usually what forces the decision, though it is not the only thing that does.
A 7B-parameter model in bfloat16 needs roughly 14 GB for its weights alone, before optimizer states, activations, or gradients. A 13B model needs around 26 GB. At 70B you are past what any single H100 can hold without aggressive offloading. Once the weights by themselves consume most of the card, the arithmetic stops working no matter how you tune the batch size.
Iteration speed matters just as much. When a single epoch stretches past a working day, you can no longer run enough experiments to learn anything from them, and distributing the work brings that cycle back into hours.
Dataset throughput is the third constraint, and it applies regardless of model size. For pretraining or large-scale fine-tuning across hundreds of millions of tokens, one GPU cannot feed itself fast enough. More GPUs mean more data workers reading and preprocessing in parallel.
Data parallelism, model parallelism, and pipeline parallelism
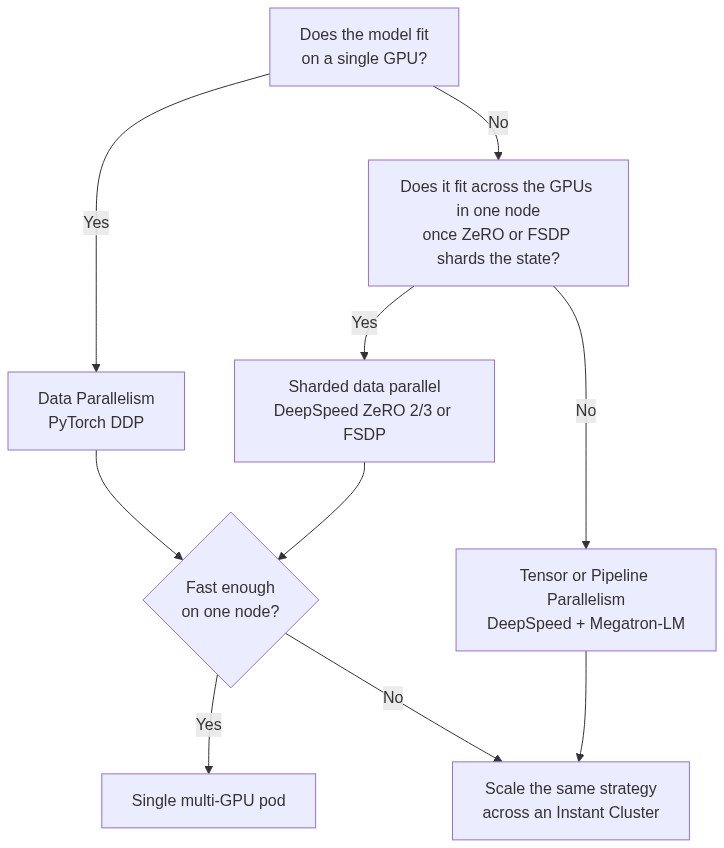
For most fine-tuning and mid-scale pretraining, data parallelism plus DeepSpeed ZeRO or PyTorch FSDP is the answer. The other strategies exist for the cases where it is not, and picking the wrong one costs days of debugging and idle GPUs.
Data parallelism replicates the full model on every GPU and splits the input batch across them. Each GPU computes gradients on its own shard of the batch, an all-reduce collective averages those gradients across the group, and every GPU then applies the same weight update. PyTorch DDP is the standard implementation, and when your model fits on one device it is all you need.
When the model no longer fits on one device, the split has to move into the model itself, putting different layers or tensor chunks on different GPUs. DeepSpeed and Megatron-LM both implement this, and model parallelism adds real engineering complexity and communication overhead compared to the data-parallel path.
Pipeline parallelism divides the model into sequential stages and feeds micro-batches through them, which keeps far more GPUs busy than naive model parallelism does. It pays for that with tuning: micro-batch size and pipeline depth both have to be right before the pipeline stops stalling.
Between plain DDP and full model parallelism sits sharded data parallelism, which is where most teams past the single-card ceiling actually land. Two implementations dominate: DeepSpeed ZeRO and PyTorch FSDP. Both are covered below, ZeRO first because its staged design makes the underlying idea easier to see.
Start with data parallelism and escalate only when ZeRO Stage 3 or FSDP runs out of room.
PyTorch DDP on a Runpod multi-GPU pod
A Runpod GPU pod supports up to eight GPUs on a single node. That eight-GPU ceiling makes a single pod the natural starting point for fine-tuning or training models up to a few billion parameters.
Step 1: Deploy a multi-GPU pod
In the Runpod console, navigate to Pods and click + Deploy Pod. Select your GPU type (H100 or A100 for serious training) and choose how many GPUs you need. Select the Runpod PyTorch template from the Template Gallery, which ships with a matched PyTorch and CUDA build so the environment is ready without manual setup. Check the gallery for the current versions, since the template tracks upstream releases. Launch the pod.
Step 2: Adapt your training script for DDP
DDP needs the process group initialized with NCCL, the model moved onto the GPU this process owns, and the model wrapped.
# train.py
import os

import torch
import torch.distributed as dist
import torch.nn as nn
from torch.nn.parallel import DistributedDataParallel as DDP
from torch.utils.data import DataLoader, TensorDataset
from torch.utils.data.distributed import DistributedSampler


def main():
    # torchrun sets LOCAL_RANK, RANK and WORLD_SIZE for every process it starts
    local_rank = int(os.environ["LOCAL_RANK"])
    torch.cuda.set_device(local_rank)
    dist.init_process_group(backend="nccl", device_id=torch.device(f"cuda:{local_rank}"))

    # Stand-in model and data: swap in your own
    model = nn.Sequential(nn.Linear(1024, 4096), nn.GELU(), nn.Linear(4096, 1024)).to(local_rank)
    model = DDP(model, device_ids=[local_rank])
    dataset = TensorDataset(torch.randn(8192, 1024), torch.randn(8192, 1024))

    # Each rank reads a different shard of the dataset
    sampler = DistributedSampler(dataset, shuffle=True)
    loader = DataLoader(dataset, batch_size=32, sampler=sampler, num_workers=4, pin_memory=True)

    optimizer = torch.optim.AdamW(model.parameters(), lr=1e-4)
    loss_fn = nn.MSELoss()

    for epoch in range(3):
        sampler.set_epoch(epoch)  # reshuffle differently on every epoch
        for inputs, targets in loader:
            inputs = inputs.to(local_rank, non_blocking=True)
            targets = targets.to(local_rank, non_blocking=True)
            optimizer.zero_grad(set_to_none=True)
            loss = loss_fn(model(inputs), targets)
            loss.backward()  # DDP averages gradients across ranks during backward
            optimizer.step()

        # Write the checkpoint from rank 0 only, then hold the other ranks until it lands
        if dist.get_rank() == 0:
            torch.save(model.module.state_dict(), f"/workspace/checkpoint-epoch{epoch}.pt")
        dist.barrier()

    dist.destroy_process_group()


if __name__ == "__main__":
    main()
Call sampler.set_epoch(epoch) at the start of every epoch. Skip it and every process sees the same data order on each pass, which degrades training quality without throwing an error.
Your effective batch size just multiplied by the number of ranks, so the learning rate you tuned on one GPU is now being applied to eight times as much data per step. Resist reaching for a formula here. The linear scaling rule that gets quoted most often comes from large-batch SGD work; Adam and AdamW conventionally use square-root scaling instead, and recent work suggests even that overshoots at large batch sizes. Retune it with a short warmup and watch the loss curve rather than trusting a multiplier.
A second failure mode is quieter, because it produces no error at all. If part of your model yields no gradient on a given step, DDP waits on an all-reduce that never arrives and the job simply hangs. DistributedDataParallel(..., find_unused_parameters=True) handles that case, at the cost of an extra graph traversal on every step, so turn it on when you hit the hang and not before.
Step 3: Launch with torchrun
On a single eight-GPU pod:
torchrun --standalone --nproc_per_node=8 train.py
torchrun handles process spawning and sets LOCAL_RANK, RANK, and WORLD_SIZE for you, so none of that coordination belongs in your script.
DDP still replicates the whole model on every GPU, so the model has to fit on one card. Past that ceiling, DeepSpeed ZeRO is the next step.
DeepSpeed ZeRO stages
DeepSpeed’s Zero Redundancy Optimizer solves the memory problem DDP leaves open. Standard DDP keeps a full copy of weights, optimizer states, and gradients on every GPU. Communication stays cheap that way, but every GPU pays full price in memory for state it will never uniquely own. ZeRO partitions that state instead, in stages that trade communication for memory.
Stage 1 partitions the optimizer states, so each GPU keeps only its shard of them and delivers roughly a 4x reduction in optimizer memory per GPU. That is a large share of the card back for one config change, because optimizer state is one of the heaviest things resident during training.
Stage 2 adds gradient partitioning on top: after the backward pass, each GPU keeps only the gradients for the parameters it owns. This is where most fine-tuning workloads settle, because the communication cost is still modest and the memory saved is large.
Stage 3 goes further and partitions the weights themselves, which is how a 70B model trains across GPUs that could never individually hold it. Each GPU now reconstructs layers on demand, so the forward pass carries extra all-gather traffic.
ZeRO-Offload, available in Stage 2 and Stage 3, moves optimizer states and gradients out to CPU RAM. On an A100 80 GB pod that stretches single-GPU training to models approaching roughly 10B parameters before you need a second card at all.
DeepSpeed installs with pip and reads a JSON config:
pip install deepspeed

# Report which DeepSpeed ops can build against this PyTorch and CUDA install
ds_report
{
  "train_micro_batch_size_per_gpu": 4,
  "gradient_accumulation_steps": 2,
  "gradient_clipping": 1.0,
  "bf16": {
    "enabled": true
  },
  "optimizer": {
    "type": "AdamW",
    "params": {
      "lr": 1e-4,
      "betas": [0.9, 0.999],
      "eps": 1e-8,
      "weight_decay": 0.01
    }
  },
  "scheduler": {
    "type": "WarmupLR",
    "params": {
      "warmup_min_lr": 0,
      "warmup_max_lr": 1e-4,
      "warmup_num_steps": 100
    }
  },
  "zero_optimization": {
    "stage": 2,
    "offload_optimizer": {
      "device": "cpu",
      "pin_memory": true
    },
    "overlap_comm": true,
    "contiguous_gradients": true
  }
}
Drop the offload_optimizer block if you are not offloading; for Stage 3 you can add offload_param alongside it. Note that DeepSpeed derives your effective global batch size from three values rather than taking it directly: train_micro_batch_size_per_gpu times gradient_accumulation_steps times the number of GPUs. The config above gives 4 x 2 x 8, or 64 samples per step on an eight-GPU pod. Change the GPU count without revisiting those keys and your effective batch size changes with it.
Launch with:
# train.py here is the DeepSpeed version of the script: argparse with deepspeed.add_config_arguments(parser)
# and deepspeed.initialize() in place of DDP; the DDP train.py above ignores these flags.
# --no_local_rank: the script reads LOCAL_RANK from the environment, as it does under torchrun
deepspeed --num_gpus=8 --no_local_rank train.py --deepspeed --deepspeed_config ds_config.json
--deepspeed is the boolean flag that turns DeepSpeed on; the config path travels separately on --deepspeed_config. Both are arguments to your script rather than the launcher, so call deepspeed.add_config_arguments(parser) on your argparse parser to accept them.
Hugging Face Trainer users pass the config path through TrainingArguments as deepspeed="ds_config.json" and the library handles the rest. One friction point comes with Stage 3, which shards checkpoints across ranks: the zero_to_fp32.py utility that ships with DeepSpeed consolidates those shards into a single file. Run it after the process group has shut down, not while other ranks are still writing.
DeepSpeed ZeRO or PyTorch FSDP?
Fully Sharded Data Parallel is PyTorch’s own implementation of the same idea. It shards parameters, gradients, and optimizer states across ranks, gathers each layer’s full parameters just in time for the forward and backward passes, then frees them again. If that sounds like ZeRO, it is. FSDP was built on the same insight and arrives at broadly the same memory profile.
The stages map onto each other, which is the fastest way to translate between the two if you already know one:
| What is sharded | DeepSpeed | FSDP |
|---|---|---|
| Nothing, full replica per GPU | ZeRO Stage 0, or plain DDP | NO_SHARD |
| Optimizer states | ZeRO Stage 1 | No direct equivalent |
| Optimizer states and gradients | ZeRO Stage 2 | SHARD_GRAD_OP |
| Optimizer states, gradients, and parameters | ZeRO Stage 3 | FULL_SHARD |
| Shard within a node, replicate across nodes | ZeRO++ hierarchical partitioning | HYBRID_SHARD |
Note the gap: FSDP has no clean equivalent to ZeRO Stage 1. If sharding optimizer states alone is exactly the amount of memory you need back, DeepSpeed gives you that step and FSDP asks you to take the larger one.
Reach for FSDP when
- You want to stay inside core PyTorch. FSDP lives in
torch.distributedwith no third-party dependency to version-match against your PyTorch build. On a fast-moving stack, that is a real maintenance saving. - You configure in code rather than JSON. FSDP is constructed in Python, so sharding strategy and wrapping policy sit in the same file as the model and can be set conditionally.
- You are composing with other PyTorch features. FSDP is developed alongside the rest of PyTorch, so it tends to work with newer features sooner.
Reach for DeepSpeed when
- You want offload. This is the clearest dividing line. ZeRO-Offload and ZeRO-Infinity move optimizer states and parameters to CPU RAM or NVMe, which can keep a model training on hardware that could not otherwise hold it. If you are memory-constrained rather than merely sharding, DeepSpeed has the deeper toolkit.
- You want to choose the stage precisely. Three distinct stages plus offload variants give finer control over the memory-versus-communication trade than FSDP’s strategies do.
- You are using Hugging Face Trainer. Both are supported, but the DeepSpeed path is the more travelled one, which matters when you are searching for someone who has hit your error before.
What the choice does not change
Neither makes your GPUs faster. Both trade communication for memory, and both let you train a model that would not otherwise fit. Expect a throughput cost relative to plain DDP in exchange for the memory you get back, and expect that cost to grow as you shard more aggressively.
Both also depend on the same things underneath. NCCL configuration, the interconnect between your GPUs, and the network between nodes affect them identically, so nothing in the Clusters section below changes based on which you pick. If you are choosing hardware to run either, the interconnect matters more than the framework: see our guide to NVLink, InfiniBand and Ethernet.
A practical suggestion. Do not agonise over this. Both are mature, both will train your model, and the memory profile at equivalent settings is close enough that the decision rarely determines whether a run succeeds. Pick the one that fits your stack, and switch only if you hit something specific: usually needing offload, which points to DeepSpeed, or wanting one fewer dependency, which points to FSDP.
One lever worth pulling before you add GPUs: activation checkpointing. Activations scale with batch size and sequence length rather than parameter count, and on long-context training they can rival the weights for memory. Checkpointing discards most of them during the forward pass and recomputes them during the backward, trading roughly 20 to 30 percent more compute for a large reduction in activation memory. PyTorch exposes it as torch.utils.checkpoint, DeepSpeed has its own activation-checkpointing config, and Hugging Face Trainer turns it on with gradient_checkpointing=True. It composes with every strategy in this guide, and it is often the difference between needing a second node and not.
Every technique to this point has been about fitting more work into eight GPUs. Past a certain size, no amount of partitioning or recomputation is enough, and the answer becomes more machines.
Moving to Runpod Clusters
Clusters provision two to eight nodes, up to 64 GPUs, in minutes. Crossing a node boundary changes where the GPUs talk to each other: inside a node they share a local bus, and on the SXM datacenter cards used for serious training that means NVLink (PCIe and consumer cards do not have it, so check against your chosen GPU type). Between nodes, every gradient synchronization crosses the network instead. Most of the setup below exists to make that crossing cheap.
Creating a Cluster
In the Runpod console, navigate to the Clusters page and click Create Cluster. You will configure:
- Cluster name: anything descriptive
- Pod count: number of nodes in the cluster
- GPU type: H100, H200, or B200 to get the full-speed inter-node fabric; A100 clusters run at half that bandwidth
- Pod Template: the Runpod PyTorch template, or your own custom Docker image
What Runpod pre-configures
Runpod sets the distributed environment variables automatically on every node, so there is no hostfile to write and no node addresses to coordinate by hand:
MASTER_ADDR/PRIMARY_ADDR: IP address of the primary nodeMASTER_PORT/PRIMARY_PORT: communication portNODE_RANK: this node’s rank (0 on the primary node)NUM_NODES: total number of nodes in the clusterNUM_TRAINERS: number of GPUs per nodeWORLD_SIZE: total GPUs across the whole cluster
PyTorch assigns LOCAL_RANK itself as it spawns each process.
Sharing the dataset and checkpoints
Every node needs to read the same dataset, and checkpoints need somewhere durable that outlives the cluster. Attach a network volume when you create the cluster and Runpod mounts it at /workspace on every node, backed by NVMe. Mounting the same volume on many nodes at once is supported and expected, so all eight nodes see one filesystem and you stage the dataset once rather than pulling a copy onto each node.
Two constraints come with it. A network volume lives in a single datacenter, which limits the cluster to wherever that volume already is, so create it in a region where your GPU type is actually available. And the NVMe sits on storage servers reached over the network rather than on the node itself, so read throughput is network-bound and shared across every node pulling from it. Size your dataloader workers and prefetch accordingly, and stage a hot subset onto local disk if the GPUs start waiting on data.
Starting the run on every node
Training does not start cluster-wide on its own. You open a web terminal on each pod and run the launch command there, once per node. On an eight-node cluster that is eight terminals, and every node needs the command before any node gets past init_process_group.
# Run in the web terminal of every node; train.py and the dataset sit on the shared /workspace volume
cd /workspace
export NCCL_SOCKET_IFNAME=ens1
export NCCL_DEBUG=INFO  # first run: logs the transport NCCL selected

torchrun \
  --nproc_per_node=$NUM_TRAINERS \
  --nnodes=$NUM_NODES \
  --node_rank=$NODE_RANK \
  --master_addr=$MASTER_ADDR \
  --master_port=$MASTER_PORT \
  train.py
NCCL_SOCKET_IFNAME=ens1 tells NCCL which network interface carries inter-node traffic. Runpod exposes the high-speed interfaces as ens1 through ens8, running at up to 3200 Gbps on H100, H200, and B200 nodes and 1600 Gbps on A100. Point NCCL at one of those and you get full cross-node bandwidth. Leave it unset and NCCL may pick the external management interface, eth0, instead. That either throttles every gradient synchronization for the life of the run or fails outright with connection timeouts between nodes, which is the single most common way a multi-node job breaks on Runpod.
Debugging NCCL on multi-node
NCCL failures at multi-node scale are almost always transport, firewall, or a node that never reached the barrier: NCCL_SOCKET_IFNAME naming the wrong adapter, a firewall blocking the ports NCCL needs beyond its control port, or one node timing out before it reaches init_process_group. Running the first job with NCCL_DEBUG=INFO prints the transport path NCCL actually selected, which usually identifies the culprit on one read.
For runs measured in hours, checkpoint frequently to persistent storage. One node failing mid-run should not cost you the whole training job.
Save from rank 0 only. Every rank is running the same script, so an unguarded torch.save means all 64 processes write the same path simultaneously and you get a corrupt file rather than a checkpoint. Wrap the write in if dist.get_rank() == 0: and follow it with dist.barrier() so the other ranks wait for it to land before continuing.
Checkpointing differs between the two sharding frameworks, and it is the one place the choice above creates real work. DeepSpeed Stage 3 writes shards per rank and needs zero_to_fp32.py to consolidate them. FSDP offers a full state dict that gathers to rank 0, which is simpler but can exhaust host memory on a large model, or a sharded state dict that avoids that at the cost of a conversion step later. Decide which you want before a long run, not after it.
Cost: multi-GPU pod vs. Cluster
Cost on Runpod is GPU-hours times the per-GPU rate, billed by the second with no minimum spend and no long-term commitment.
That makes the comparison simpler than it first looks. Sixty-four GPUs for one hour and eight GPUs for eight hours are both 64 GPU-hours, so at the same per-GPU rate a cluster is not inherently the more expensive option. It buys the same compute in a fraction of the wall-clock time. What breaks the equivalence is scaling efficiency: a single pod keeps all eight GPUs on one node with no inter-node traffic, so utilization stays high, while across nodes every gradient synchronization crosses the network. Whatever efficiency you give up there is the real premium for finishing sooner, and it is why doubling the GPUs rarely halves the training time.
Put numbers on it. Fine-tuning a 13B model for 20 hours on an eight-GPU H100 SXM pod is 160 GPU-hours. At the current Secure Cloud rate of $3.49 per GPU-hour, multiply that out for your own budget. Run those same 160 GPU-hours as a two-node, 16-GPU cluster and the compute bill is comparable while the job finishes in roughly half the wall-clock time, less whatever you surrender to inter-node synchronization. Drop to A100 80 GB SXM at $1.59 and the same run costs well under half, which is the more consequential decision than pod-versus-cluster.
One caveat on Community Cloud: network volumes are a Secure Cloud feature, so a Community Cloud pod gives you no persistent shared storage and checkpoints have to land on the container disk or get pushed to an external store before the pod goes away.
So the choice is rarely about the hourly rate. For most fine-tuning work, including large models under DeepSpeed ZeRO or FSDP, an eight-GPU pod is hard to beat on cost per unit of work, and the card you pick moves the bill further than the pod-or-cluster question does. Rates move, so confirm against Runpod’s pricing page before you budget.
Whichever you land on, validate the training loop and your DeepSpeed or FSDP config on a single multi-GPU pod first. Debugging a distributed job is enough work across eight processes; across 64, on nodes you are paying for by the second, it is a different problem.
Frequently asked questions
How do I know the extra GPUs are actually helping?
Measure throughput, not utilization. nvidia-smi showing every card at 100% tells you the GPUs are busy, not that they are busy doing useful work: a badly configured job can spend most of its time waiting on gradient synchronization and still look saturated. Log samples per second across the whole run and compare it against your single-GPU baseline. Eight GPUs returning six to seven times the throughput is a healthy result. Three or four times means something is wrong, and the usual causes are a per-GPU batch too small to keep the card fed, a dataloader that cannot supply data fast enough, or NCCL quietly running over the wrong interface.
Is FSDP or DeepSpeed faster?
At equivalent sharding levels, close enough that it is rarely the deciding factor. Both trade communication for memory in the same way, so throughput tracks how aggressively you shard far more than which library does the sharding. Choose on features and dependencies, then measure your own workload rather than trusting a general benchmark. If one is clearly faster for you, it is usually because of a configuration difference rather than the framework.
Can I switch from DeepSpeed to FSDP later?
Yes, and it is a smaller change than it sounds if you are using Hugging Face Trainer, which supports both. The friction is checkpoints: formats differ, so plan a conversion step rather than expecting a DeepSpeed Stage 3 checkpoint to load straight into FSDP. Switch between runs, not in the middle of one.
What happens if one node fails partway through a multi-node run?
The job stops. NCCL collectives are synchronous, so when one rank disappears the rest block until the operation times out and the run dies, usually with an NCCL error rather than a clean message. Nothing fails over automatically: you replace the node, relaunch on every node, and resume from the last checkpoint. That is what makes checkpoint frequency a decision about how much wall-clock time you can afford to lose, and why those checkpoints belong on a network volume rather than a node’s local disk.
Can I use Hugging Face Trainer with DeepSpeed ZeRO on Runpod?
Yes, and it carries to clusters without extra work. Pass the config path via deepspeed="ds_config.json" in TrainingArguments, and Trainer handles the distributed setup itself, reading the same WORLD_SIZE, NODE_RANK, and MASTER_ADDR values Runpod sets on every node. FSDP works the same way through Trainer’s fsdp arguments. You still launch it once per node, and the Stage 3 checkpoint consolidation described above still applies.
Getting started
The whole decision reduces to one question: does the job fit in a single node’s memory and finish on a schedule you can live with? If it does, deploy a multi-GPU pod. If it does not, create a Cluster.
The DDP initialization, DeepSpeed ZeRO config, FSDP sharding strategy, and NCCL environment variables described here carry across every Runpod pod and cluster configuration, so the fine-tuning workflow you already run does not change as you scale it. If you got here from LoRA and QLoRA fine-tuning, none of that changes either. Same container, same model. You just have more GPUs behind it.