Your model is deployed, requests are going through, and your GPU bill is climbing faster than your usage justifies.
Most guides help you get a model running on Runpod Serverless and stop there. What actually drives inference cost is how efficiently each request uses the GPU you’re paying for, and a default deployment leaves a lot of that efficiency on the table.
The delta between a default deployment and a tuned one is mostly configuration. This guide covers the four levers that move the needle most: batching strategy, quantization, KV cache management, and profiling. At the end, you’ll find a worked configuration for Llama-3-8B on an RTX 4090, with Runpod’s published throughput and latency figures for that deployment.
Why LLM Inference Costs More Than You Expect
Default vLLM deployments on Runpod Serverless work, but stock settings leave throughput on the table. Two things cause most of that gap: a batch ceiling that was never matched to your hardware, and over-provisioned KV cache memory.
When requests arrive one at a time and each waits for the previous to finish, you’re running at a fraction of capacity. Static batching fills a fixed batch before processing, which introduces queuing latency and leaves the GPU idle whenever a batch runs short. Runpod measures GPU utilization falling to 20–40% on mixed-length workloads under static batching. Real-world traffic is bursty and uneven, so a strategy built for uniform load will underperform on the traffic you actually have.
Model weights are only one part of the VRAM picture. The KV cache (the memory structure that stores attention key-value tensors across generation steps) scales with context length and batch size. Setting MAX_MODEL_LEN to the model’s maximum, say 128K tokens for Llama-3.1, reserves space for contexts you’ll probably never hit, and that reserved memory can’t be used for concurrent sequences, so it caps throughput directly. Runpod’s GPU Memory Sizing Guide for LLM Inference covers how to size VRAM correctly before you start tuning.
Of those two causes, batching is the cheaper one to address, and on vLLM most of the work is already done for you.
Continuous Batching: How It Works and What to Expect
Continuous batching (also called iteration-level scheduling) processes requests at the token-generation level instead of waiting for a full static batch to complete. As soon as one sequence finishes, a new one takes its slot. GPU utilization stays high, and queue wait times stay low.
Static batching fills a batch, runs it, waits for all sequences to finish, then loads the next batch. That waiting is wasted GPU time, and continuous batching eliminates it by scheduling at the iteration level.
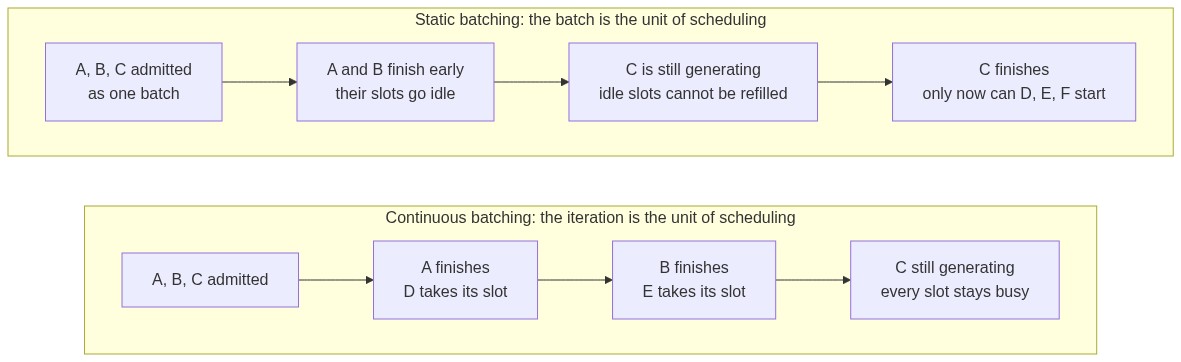
vLLM enables continuous batching by default. On Runpod Serverless, the key variable is MAX_NUM_SEQS, the maximum number of sequences processed simultaneously. Set it in your endpoint’s environment variables via the Runpod console: Manage, then Edit Endpoint, then Environment Variables.
The default is 256. That’s a reasonable starting point for high-traffic production endpoints, though it runs too high for profiling work or for smaller GPUs where VRAM is tight. If you’re running Llama-3-8B AWQ on an RTX 4090, start at 128 and watch your vllm:kv_cache_usage_perc metric before increasing it. Larger hardware serving high-traffic APIs can go considerably higher; find your own ceiling by measurement, since it depends on model size and VRAM headroom.
For autoscaler sizing, peak_concurrent_users / MAX_NUM_SEQS gives you a floor: 500 concurrent users at 128 sequences per worker needs four workers. That arithmetic assumes requests arrive evenly, which the bursty traffic described earlier is precisely what violates. Add headroom in proportion to how spiky your arrival pattern actually is.
Published vLLM benchmarks document large throughput gains from continuous batching on fixed hardware. The size of the gain on your endpoint depends on request arrival pattern and sequence length distribution, but the mechanism is straightforward: the GPU stops waiting.
What caps that gain is how many sequences fit in VRAM at once, and the first claim on VRAM is the weights themselves.
Quantization Options: INT8, FP16, AWQ, GPTQ
Quantization shrinks that weight footprint, and smaller weights also move faster through memory. The trade-off is accuracy against memory against throughput, and the right choice depends on your hardware, model, and tolerance for quality loss.
| Format | Memory per param | vLLM env var | Best for |
|---|---|---|---|
| FP16 / BF16 | 2 bytes | DTYPE=float16 or bfloat16 | Max accuracy, VRAM not a constraint |
| INT8 | 1 byte | QUANTIZATION=bitsandbytes | Moderate savings, lower accuracy risk |
| AWQ (4-bit) | 0.5 bytes | QUANTIZATION=awq | Production inference, Llama-class models |
| GPTQ (4-bit) | 0.5 bytes | QUANTIZATION=gptq | Broad model support, offline quantization |
FP16 / BF16 is the accuracy baseline. Reach for it when VRAM isn’t the binding constraint, or when any degradation is unacceptable: internal tools, evaluation pipelines, safety-critical outputs.
INT8 halves memory per parameter and costs most general-purpose models very little quality. It’s a practical stepping stone before you commit to 4-bit.
At 4-bit, the choice gets more interesting. AWQ has become the standard for Llama-class production endpoints because of how it picks its targets. Activation-Aware Weight Quantization uses activation magnitudes to decide which weights can be quantized safely, which preserves more accuracy than treating every weight the same way. The practical payoff shows up at scale. Llama-3-70B needs roughly 140 GB for weights at BF16, so it spans multiple GPUs; at 0.5 bytes per parameter that drops to about 35 GB, which fits on a single 80 GB A100 with room left for the KV cache.
GPTQ lands at the same 0.5 bytes per parameter through different calibration, and covers a wider spread of model architectures in practice. That breadth is usually what decides it: reach for GPTQ when no AWQ checkpoint exists for your model, or when you need to quantize offline against your own dataset.
One constraint worth knowing: vLLM does not perform AWQ or GPTQ quantization at load time, so those checkpoints must already be quantized before deployment. Set QUANTIZATION=awq or QUANTIZATION=gptq in your endpoint’s environment variables and point at a pre-quantized checkpoint on HuggingFace. The worker also accepts bitsandbytes and squeezellm. On H100 GPUs, FP8 quantization is natively supported. It reduces VRAM usage by approximately 50% against BF16 and improves throughput by up to 1.6x.
Shrinking the weights clears only half the VRAM budget, though. The other half moves with your traffic.
KV Cache Management and TTFT
Time To First Token (TTFT) is the metric users actually feel, and the primary drivers are prefill latency and KV cache pressure. vLLM’s PagedAttention manages the KV cache by dividing it into fixed-size pages allocated on demand, the same idea as virtual memory in an operating system. That cuts wasted cache memory from 60–80% in naive pre-allocation schemes to under 4%, freeing VRAM for more concurrent sequences.
During prefill, the model processes the entire input prompt in one pass, and that cost scales roughly linearly with prompt length. The attention step itself is quadratic, but it only starts to dominate at very long contexts, on the order of tens of thousands of tokens. Long-context requests are still disproportionately expensive twice over: in the cache they occupy while generating, and in the time they take to produce a first token.
The main control is GPU_MEMORY_UTILIZATION. The Runpod vLLM worker defaults to 0.95, meaning 95% of VRAM goes to model weights plus KV cache, with 5% held back for activation memory, framework overhead, and CUDA context. That is already aggressive, so treat it as a ceiling rather than a dial to turn up. Drop it to 0.90 or 0.85 if you’re seeing out-of-memory errors, and note that the upstream vLLM default is 0.90, which is why you will see that figure quoted for self-managed deployments.
MAX_MODEL_LEN is the other lever, and it sizes the cache to the prompts you actually serve. For a deployment where 95% of prompts stay under 4K tokens, MAX_MODEL_LEN=4096 returns the difference to the batch, and vLLM rejects longer requests cleanly instead of failing silently. Take that percentile from your own logs rather than from intuition, because the tail is what fills the cache and it usually runs longer than it feels.
Most tuning gains live in the interaction between GPU_MEMORY_UTILIZATION, MAX_MODEL_LEN, and MAX_NUM_SEQS, which is also why none of the three can be judged in isolation. Moving one changes what the other two are worth.
Profiling Your Endpoint: Runpod Metrics and PostHog
Everything above was set by reasoning about your workload. Profiling is how you find out whether the reasoning held, and it draws on three layers: what the Runpod console shows you, what vLLM reports about its own internals, and what your product analytics can tell you once the two are joined.
What the console gives you for free
Runpod’s Serverless Monitoring Dashboard at console.runpod.io/serverless reports execution time, delay time, cold start time, and request counts in real time. Those four numbers locate the problem even before you instrument anything.
Delay time running high against execution time is an under-provisioning signal: raise MAX_NUM_SEQS, or your max worker count. Invert the ratio, with execution time high and GPU utilization low, and the problem sits in batching or quantization instead. Read both at the percentile level rather than as averages. For uptime checks, poll the health endpoint at GET https://api.runpod.ai/v2/{endpoint_id}/health and catch unhealthy workers before your users do.
Reading vLLM’s own metrics
The console sees your endpoint from the outside. To understand why the GPU is behaving the way it is, you need vLLM’s view, which it publishes on a Prometheus-compatible /metrics endpoint on the same port as the API server. It needs no authentication even when an API key is set, so scraping costs you no credential coordination.
Four metrics carry most of the diagnostic weight:
vllm:kv_cache_usage_perc, the fraction of KV cache capacity in use, reported on a 0 to 1 scale despite the name. Older vLLM builds exposed this asvllm:gpu_cache_usage_perc, so check which name your image actually emitsvllm:num_preemptions_total, how often vLLM has evicted a running sequence to free cachevllm:num_requests_running, how many sequences are being processed right nowvllm:generation_tokens_total, a cumulative token counter you turn into throughput withrate(vllm:generation_tokens_total[1m])
That 0 to 1 scale is worth pausing on, because the _perc suffix invites an alert rule that never fires. Sustained kv_cache_usage_perc above 0.9, not 90, means the server is approaching its KV cache limit and will start preempting sequences, which a climbing num_preemptions_total confirms. Reduce MAX_MODEL_LEN or MAX_NUM_SEQS, since GPU_MEMORY_UTILIZATION is already near its ceiling by default. A different signature points elsewhere: num_requests_running sitting well below your MAX_NUM_SEQS while delay time stays high usually means cold starts, not saturation. Runpod’s FlashBoot addresses that path by caching container and model artifacts and pre-initializing GPU contexts, bringing cold starts as low as 200ms against the 30–120 seconds a naive container deployment pays for model loading.
Reaching that endpoint is where a lot of monitoring advice quietly assumes the wrong deployment. On a Pod you can expose the port over the HTTP proxy or direct TCP, which gives Prometheus a stable target:
# Keep the job that matches how port 8000 is exposed on the vLLM Pod
scrape_configs:
  # HTTP proxy: port 8000 listed as an HTTP port
  - job_name: vllm-proxy
    scheme: https
    metrics_path: /metrics
    static_configs:
      - targets: ["{POD_ID}-8000.proxy.runpod.net"]
  # Direct TCP: port 8000 listed as a TCP port; use the Pod's public IP and the
  # external port mapped to 8000, both shown in the Pod's Connect menu; the external
  # port changes whenever the Pod resets, so the proxy job is the steadier target
  - job_name: vllm-tcp
    metrics_path: /metrics
    static_configs:
      - targets: ["{POD_PUBLIC_IP}:{EXTERNAL_PORT}"]
Hosting Prometheus on Runpod itself takes one adjustment: the single-container model rules out a sidecar, so launch a separate pod from the prom/prometheus image and point it at your vLLM pod. Runpod’s LLM Inference Optimization Playbook walks through that setup in more detail.
A queue-based Serverless endpoint gives you no equivalent handle. Workers are ephemeral, they scale to zero, and traffic reaches them through the job API rather than an address you control, so there is nothing at a fixed host and port for a scraper to poll. Three approaches work around that. Run your tuning passes on a Pod with the same image and configuration, read /metrics directly, then carry the settings across. Switch to a load balancing endpoint, which routes HTTP straight to workers instead of queuing them, when you need a direct request path. That trade is not free: without the queue, an overloaded endpoint drops requests rather than buffering them, and there is no automatic retry. Or push metrics out from inside the worker to a collector you own, so nothing has to find your workers at all.
Correlating cost with product usage
Both layers so far describe the endpoint in isolation. They tell you an endpoint is expensive; they cannot tell you which feature made it expensive, and that second number is the one that changes a roadmap. Getting it means putting inference cost next to product events.
Runpod exposes the operational data programmatically through its REST API at https://rest.runpod.io/v1, including per-endpoint and per-pod billing history with hourly or daily bucketing. That opens a path into PostHog, with one caveat worth stating plainly: there is no turnkey Runpod connector, so this is an integration you build. A scheduled job reads the billing resources from the Runpod API and forwards them to PostHog’s capture API as events, with cost and utilization attached as properties. Once the data lands, it behaves like any other event stream, so you can join it against product events in HogQL.
Here is a minimal version of that forwarder, suitable for a daily cron job:
# Run once a day after 00:00 UTC (a re-run sends the same buckets again), for example from cron: 30 0 * * * python3 forward_billing.py
import os
from datetime import datetime, timedelta, timezone

import requests

RUNPOD_API = "https://rest.runpod.io/v1"
POSTHOG_HOST = os.environ.get("POSTHOG_HOST", "https://us.i.posthog.com")  # EU Cloud: https://eu.i.posthog.com

# Yesterday (UTC) in hourly buckets
today = datetime.now(timezone.utc).replace(hour=0, minute=0, second=0, microsecond=0)
params = {
    "bucketSize": "hour",
    "startTime": (today - timedelta(days=1)).strftime("%Y-%m-%dT%H:%M:%SZ"),
    "endTime": (today - timedelta(seconds=1)).strftime("%Y-%m-%dT%H:%M:%SZ"),
}
headers = {"Authorization": f"Bearer {os.environ['RUNPOD_API_KEY']}"}

events = []
for resource, grouping in (("endpoints", "endpointId"), ("pods", "podId")):
    resp = requests.get(
        f"{RUNPOD_API}/billing/{resource}",
        headers=headers,
        params={**params, "grouping": grouping},
        timeout=30,
    )
    resp.raise_for_status()
    for row in resp.json() or []:
        events.append({
            "event": "runpod_billing",
            "distinct_id": "runpod-billing",
            "timestamp": row.get("time"),
            "properties": {
                "amount": row.get("amount"),
                "endpointId": row.get("endpointId"),
                "gpuTypeId": row.get("gpuTypeId"),
                "podId": row.get("podId"),
                "timeBilledMs": row.get("timeBilledMs"),
                "diskSpaceBilledGb": row.get("diskSpaceBilledGb"),
                "$process_person_profile": False,  # anonymous events, no person profiles
            },
        })

if events:
    resp = requests.post(
        f"{POSTHOG_HOST}/batch/",
        json={
            "api_key": os.environ["POSTHOG_PROJECT_TOKEN"],
            "historical_migration": False,  # True only when backfilling buckets older than 48 hours
            "batch": events,
        },
        timeout=30,
    )
    resp.raise_for_status()
print(f"Forwarded {len(events)} billing rows to PostHog")
Those property names come from the billing response schema, which returns amount, endpointId, gpuTypeId, podId, time, timeBilledMs, and diskSpaceBilledGb per row. Confirm them against the API reference for your account before you rely on them, and note that backfilling buckets older than 48 hours needs historical_migration: true in the PostHog payload. The guards around .get() are there precisely because that shape is not yours to control.
With cost per feature sitting next to the endpoint metrics, a configuration change can finally be judged on what it did to the bill, which is the argument you actually have to make to the rest of the business.
Tuned vs. Untuned: Same Model, Same Hardware
Continuous batching, AWQ quantization, and right-sized KV cache compound on the same model and hardware, because each lever enables the next. Quantization buys the headroom that makes a larger MAX_NUM_SEQS viable, and that wider batch window is what continuous batching needs to stay busy. Run them out of order and each one starves the next.
For a concrete reference point, Runpod’s benchmarked deployment scenarios measured an AWQ 4-bit Llama-3-8B on a single RTX 4090 at roughly 3,500 tokens/sec with ~120ms TTFT, at batch size 32 on a 256-token input and 512-token output workload with continuous batching enabled.
Translating that into cost depends on which product you run it on, so check current pricing before you model it: Runpod puts the benchmark above at about six cents per million tokens on a dedicated pod, and a Community Cloud card lands nearer three, while Serverless bills per second of actual compute and scales to zero between requests, which changes the arithmetic entirely for bursty traffic.
Those figures are the destination, reached by stacking the three levers in order:
| Configuration | Key change | What it changes |
|---|---|---|
Baseline (FP16 weights, MAX_NUM_SEQS=256, MAX_MODEL_LEN unset) |
Stock defaults | Batch ceiling and cache sized by the model, not by your traffic |
+ Batch ceiling right-sized (MAX_NUM_SEQS=128) |
Ceiling matched to 24 GB of VRAM | Continuous batching, already on by default, stops competing with itself for cache; fewer preemptions |
+ AWQ quantization (QUANTIZATION=awq) |
0.5 bytes/param against 2 bytes/param for FP16 | 75% less weight VRAM, which the scheduler can spend on batch slots |
+ KV cache tuning (MAX_MODEL_LEN=4096) |
Cache sized to real prompts, not to the model maximum | Lower TTFT on typical prompts, kv_cache_usage_perc below 0.9 |
Two caveats on reading that table. Only the tuned endpoint carries published figures, so the per-lever rows explain where the gains come from; they are not measured deltas you can quote. And treat that endpoint as a starting point to measure against, because your own throughput and TTFT will land somewhere else.
Where they land depends on the shape of your workload. A chatbot carrying long conversational context needs a different MAX_MODEL_LEN than a classification endpoint fielding 200-token prompts. The vLLM guide on Runpod Serverless covers the baseline setup, and from there you tune the three variables against what your endpoint actually sees.
Frequently Asked Questions
Four questions the guide above raises without stopping to answer.
How do I actually measure my 95th-percentile prompt length?
Log the raw prompts your endpoint receives for a few days, then run them through the same tokenizer your model uses and take the 95th percentile of the token counts:
# pip install transformers jinja2
import json

import numpy as np
from transformers import AutoTokenizer

MODEL = "casperhansen/llama-3-8b-instruct-awq"  # the model your endpoint serves
SYSTEM_PROMPT = "You are a helpful assistant."  # anything you prepend at request time

tokenizer = AutoTokenizer.from_pretrained(MODEL)

counts = []
with open("prompts.jsonl") as f:  # one logged user prompt per line: {"prompt": "..."}
    for line in f:
        messages = [
            {"role": "system", "content": SYSTEM_PROMPT},
            {"role": "user", "content": json.loads(line)["prompt"]},
        ]
        # Count the prompt vLLM sees: system prompt, chat template and user text
        encoded = tokenizer.apply_chat_template(messages, add_generation_prompt=True, return_dict=True)
        counts.append(len(encoded["input_ids"]))

p95 = int(np.ceil(np.percentile(counts, 95)))
print(f"{len(counts)} prompts, p95 {p95} tokens, max {max(counts)} tokens")
Character length is a poor proxy here, since code, JSON, and non-English text tokenize very differently from prose. Count anything you prepend at request time as well: system prompts and few-shot examples land in the same cache allocation, because vLLM sizes against the full assembled prompt, not the user’s portion of it.
On an H100, should I use FP8 or AWQ?
FP8, and Runpod’s quantization decision tree is blunt about it: on H100 and H200, FP8 is the format worth using. You get roughly 50% VRAM reduction for under 1% perplexity delta, running on native Hopper tensor cores with no emulation overhead.
The interesting part is why the answer flips on Ada Lovelace, because it is not a hardware gap. The RTX 4090 and RTX 6000 Ada have FP8 tensor cores too. The decision turns on what each format buys you: AWQ’s 4-bit weights cut roughly 70% of VRAM against FP8’s 50%, and on a 24 GB card that extra headroom converts directly into concurrent sequences. You pay for it with a wider accuracy margin, around 3% perplexity delta against FP8’s sub-1%, and AWQ’s GEMM kernels are well optimized for the Ada architecture. On an 80 GB H100 the VRAM pressure that makes that trade worthwhile mostly disappears, so the accuracy advantage wins instead.
One more consideration if your workload is long-context: KV cache quantization is currently FP8-only in vLLM, so the H100 path lets you compress the cache as well as the weights.
What does a preemption actually cost me?
More than the counter suggests. When the KV cache pool fills past its threshold, vLLM’s scheduler evicts running sequences, and how much that hurts depends on the preemption mode. Under recompute, the default in vLLM V1, an evicted sequence reruns its prefill from scratch when it is re-admitted. You pay that prompt’s most expensive phase twice, and the user sees it as a stalled generation partway through a response.
Which sequence gets evicted is worth knowing, because the intuition runs backwards. Under the default first-come-first-served policy the scheduler pops the most recently admitted request, so the oldest in-flight sequences are the ones protected and new arrivals absorb the pressure. Your long-running requests are safe; the traffic you just accepted is not. This is why a climbing vllm:num_preemptions_total deserves attention even when your throughput numbers still look acceptable: the average hides the requests that got evicted.
My prompts share a long system prefix. Does that change the calculus?
Considerably. vLLM’s prefix caching stores KV blocks for shared prompt prefixes and reuses them across requests, so a fixed system prompt, chat template, or few-shot block gets its cache computed once instead of on every call. For agent workloads and chat products that ship the same preamble with every request, this cuts prefill work directly, which is the phase driving your TTFT. Recent vLLM versions enable it by default, so check your version before adding --enable-prefix-caching explicitly. It also changes how you read your own metrics: with prefix caching active, cache occupancy reflects shared blocks that are doing useful work for many requests at once, not per-request bloat.
Deploy and Tune
Deploy with MAX_NUM_SEQS=128, an AWQ or GPTQ checkpoint, and MAX_MODEL_LEN matched to your 95th-percentile context length. Give that configuration a full day of production traffic before touching anything. Then move a single setting and watch what the metrics do, because moving two leaves you unable to say which one worked.
None of these levers asks you to change your model or your hardware. They are environment variables, so trying one costs a redeploy and little else. The metrics are what turn that cheap experiment into a decision, and the bill is where the answer shows up.
If cold starts turn out to be the bottleneck, that path needs no work from you: FlashBoot is already active on Serverless endpoints, which is where the sub-200ms figure comes from. For the worker and scaling model those numbers depend on, see the Runpod Serverless documentation. And if you would rather deploy functions straight from Python than manage endpoint configuration at all, Runpod Flash is a separate SDK-based path onto the same infrastructure.